ANNUAL REPORT 2017 | 23
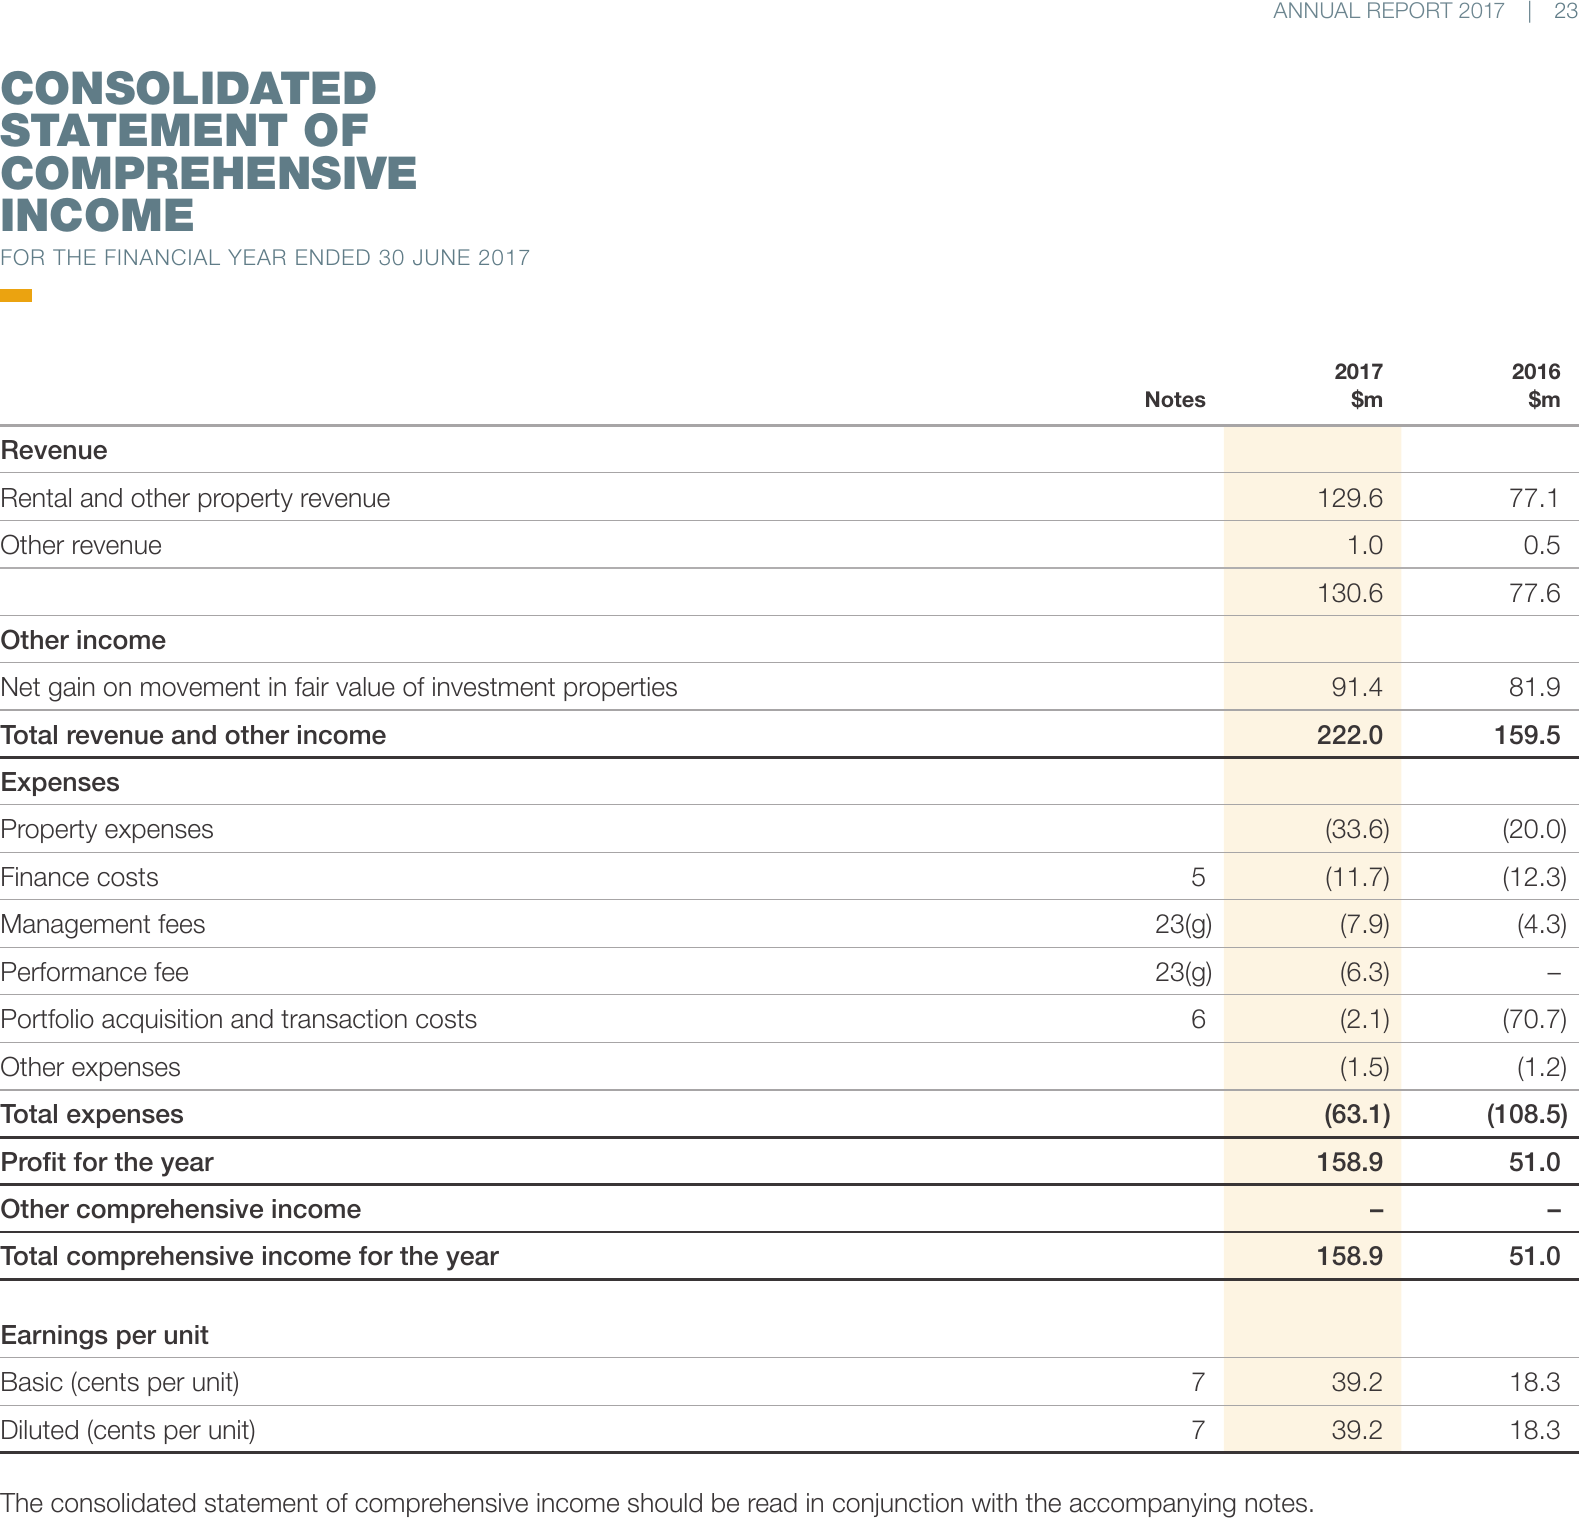
CONSOLIDATED
STATEMENT OF
COMPREHENSIVE
INCOME
FOR THE FINANCIAL YEAR ENDED 30 JUNE 2017
2017
$m
2016
$m
129.6
77.1
1.0
0.5
130.6
Notes
77.6
Revenue
Rental and other property revenue
Other revenue
Other income
Net gain on movement in fair value of investment properties
91.4
81.9
222.0
159.5
(33.6)
(20.0)
5
(11.7)
(12.3)
Management fees
23(g)
(7.9)
(4.3)
Performance fee
23(g)
(6.3)
–
6
(2.1)
(70.7)
Other expenses
(1.5)
(1.2)
Total expenses
(63.1)
(108.5)
Profit for the year
158.9
51.0
–
–
158.9
51.0
Total revenue and other income
Expenses
Property expenses
Finance costs
Portfolio acquisition and transaction costs
Other comprehensive income
Total comprehensive income for the year
Earnings per unit
Basic (cents per unit)
7
39.2
18.3
Diluted (cents per unit)
7
39.2
18.3
The consolidated statement of comprehensive income should be read in conjunction with the accompanying notes.